
At the Consumer Metrics Institute we have been monitoring the impact of last year's consumer oriented Federal stimuli on both the past spring's "green shoots" and our year-over-year measurements of consumer demand. Typical of the kinds of stimuli we saw was the "cash for clunkers" promotion, which created the glaringly obvious upward demand blip that could be still seen in our Domestic Autos Sub-Index a few months back:Bottom line: The economy in 2008-09 was prevented from properly re-adjusting from previous Federal Reserve money printing induced distortions in the economy.On a short-term basis the government sought to prop up parts of the distorted economy, chiefly the housing and auto sectors. Now that those propping up activities are over, the economy on a delayed basis is attempting to adjust away from the distortions. This is, along with the lack of Fed money printing, what the second leg of the recession is about.
Also obvious in our data is the impact of the Federal Housing Tax Credit, which (although extended several times in several different forms) was originally intended to expire in November, 2009. Again this can be clearly seen in a chart from a few months back:
The above chart indicates that potential home buyers with both the opportunity and means to take advantage of the tax credit did most of their leg work before the expiration of the original purchasing deadline. Our data also seems to tell us that the subsequent extensions did not draw substantial numbers of additional buyers to the party, although the extensions may have delayed transactions or accommodated closings that would not have been sufficiently timely. It is important to remember that our internet based measures of consumer demand don't directly capture closings, but instead see leading activities further "up stream", such as loan applications, insurance applications and home inspection engagements.
No two sectors of the economy impact the GDP more than housing and autos. The above charts explain three things:
► The "green shoots" of recovery that were widely reported in the press in late 2009 and early 2010.
► Our year-over-year growth numbers plummeting now, a year later.
► What consumers have done since the stimuli expired.
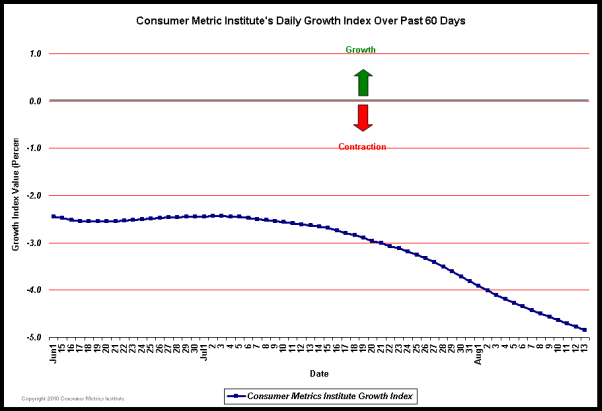
As a result of last year's artificially stimulated "green shoots", our current year-over-year measurements of consumer demand suffer significantly by comparison. Our Daily Growth Index continues to decline, and we expect the year-over-year data to continue to suffer during August because of the now lapsed year-ago stimulus packages:
Our current negative "growth" measurements tell us that the "green shoots" withered and died when the spigot of Federal stimulus was turned off. We see no signs of "organic" or structural recovery yet in either the housing or the automotive sectors of the economy. The economy is not behaving like it did during other "V" shaped recessions we have seen recently, when conditions returned to the "good old days" after several quarters...
The numbers that go with the above chart are not good. Our 91-Day trailing "quarter" Daily Growth Index has dropped to a contraction rate approaching 5%, while the 183-Day trailing "two quarters" is contracting at more than a 3% year-over-year rate. To put these numbers in perspective, less than 2.5% of all quarters since 1947 have had GDP "growth" that was worse. Additionally, fewer than 3% of any two consecutive quarters of GDP "growth" have been worse than our trailing six months. Ignoring 2008 for a moment, the past quarter by itself would be something we might expect only once in every decade...
We have revised our popular Contraction Watch to simplify and extend the comparison between the two most recent contractions that we have monitored: the "Great Recession" of 2008 and the 2010 event that we have been watching unfold on a day by day basis since January 15th, 2010:
The two contraction events charted in the above graph are depicted using identical year-over-year methodologies, so the chart presents a true apples-to-apples comparison between contractions. The true severity of each event is proportional to the area between the event's track and the gray "zero" line, and the total area of the 2010 event is now about half of the area traced by the entire 2008 episode. Clearly, at its lowest point the "Great Recession" of 2008 dropped to a greater contraction rate than we have yet seen during the current 2010 event. But the shape of the 2010 event remains troubling, with its daily level of contraction now having crossed the track of the "Great Recession" event -- meaning that at about 210 days the "Great Recession" had already recovered to the point far above the day to day level we are experiencing now.
Looking at this chart we can also see that the "Great Recession" had swung back into growth by 220 days, while the shape of the 2010 event indicates a probable duration that will be significantly longer. We may ultimately look back on 2008 as a relatively brief economic downturn that was a prelude to something much longer.


It was inevitable that the government had to stop its propping up activities since it doesn't have the money to extend them. However, as the second leg of the downturn intensifies, the government may again try some type of propping up activities and hope the money is available in the open markets to borrow for such activities. If the money isn't there at a "reasonable" interest rate, the government would look to the Federal Reserve to buy up such debt. This, of course, would be highly inflationary.
Alternatively, the Fed may on its own may begin to rapidly grow the money supply to "get the economy going". This, of course, would also be highly inflationary,
Thus, out on the horizon, accelerating inflation appears to be a likely scenario. But, for now, a downtrend in the economy and downward pressure on prices, especially stock prices, will continue.
No comments:
Post a Comment