
 I am not a big chart guy. For some reason, my mind tends to work better looking at numbers, the percentages and the changes in numbers, rather than the chart of such. As long-time readers know, I have been jumping up and down about the slowdown in M2 nsa money growth that has occurred since late February/early March. Well the same thing happened last summer, money growth stopped. I recently posted a links to the warnings I made last year, before the peek of the financial crisis last September. Those links are here, here, here, here, here, here, here and here.
This summer's slowdown is pretty much a rerun.
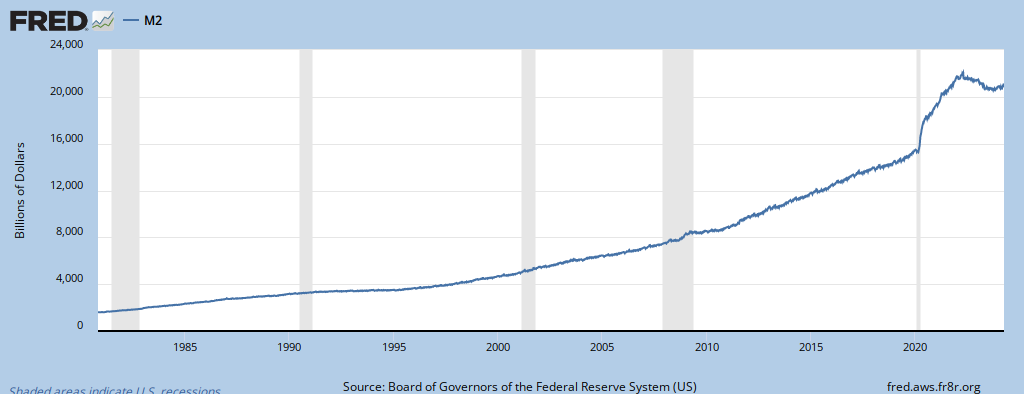
Anyway, after posting the links above, Bob Murphy "went to the videotape" and produced the above chart of M2 nsa which sure does prove my point that there was little money growth in the summer of 2008 and even less (actually declining) money growth this summer.
This is why I remain bearish on the stock market and economy. There was a huge blast of money growth from September 2008 to February 2009. This is what I believe is fueling the current stock market run, the better economic numbers and, sorry folks, the gold climb.
I saw this upturn coming because of that Sept 08 to Feb 09, 15% annualized money growth. Back then, I was one of the few who was bullish, in February, I wrote:
Irwin Kellner, chief economist for MarketWatch, seems to be the only other economists that is viewing the current economy from the same perspective I am. I fully expect this recession to be over much sooner than most expect.I even went bullish on the stock market for awhile, in March, I wrote:
Folks, this is known as a BUY SIGNAL.As an indication of how bearish most people were in March, an anonymous commenter to my post wrote:
The rocket fuel the Fed has been pumping since September has started to launch some rockets.
At March 22, 2009 4:22 AM , Anonymous said...I backed that comment up in May with a post that said:
BUY SIGNAL ???
are u serious? bear market is over? i was expecting some real pain or riots before this whole recession thing is over.
Back on March 9, the S&P 500 and other major indexes were at 12-year lows. The S&P 500 has jumped 34% since then, and is in positive territory for the year, up 0.44%.But by July, it had been more than three months of Fed slowed growth, so it was time (for me anyway) to take profits in the stock market. I warned of the new danger to the economy and stock market here and here. As the summer moved along I intensified my warnings. An economy that survives on Federal Reserve manipulated money printing is seeing for the second time in less than two years the Fed (for whatever reason) putting a halt to money printing. The halt in money printing is also dovetailing right into a period that is generally tough for the stock market. I have explained why, here and here.
We wrote near the start of this Bull Market move:
Folks, this is known as a BUY SIGNAL.
The rocket fuel the Fed has been pumping since September has started to
launch some rockets.
With the Fed continuing to print money at an annualized rate of between 10% and 15%, we see no reason to alter our bullish stance
Forecasting is always a tricky business. I am most confident in my warnings about the stock market. The money printing fuel just isn't there to keep it aloft. I am going out on a limb with my gold call, especially with it flirting with new all time highs. If it breaks through to record levels, it will spike higher and I will have egg on my face (at least short-term), BUT again, there is no new money printing to support the gold spike, However, (and this is what makes my bearish call on gold tough) there are nervous international holders of dollars that could cause a huge run into the metal. It could happen at anytime. This is why I am most nervous about this call, though I still suspect that the lack of money printing will pull a rug from under gold, and most certainly the current run in the stock market.
As for the economy, overall, it remains a mess. The upticks, as I have pointed out, for the most part are in the sectors where bailout money was pumped in. Thus, the "recovery" in the numbers has been pretty much a manipulated recovery. Further, that bailout money has pretty much been stopped. What manipulations the government attempts from here to goose the numbers, who knows? But it sure doesn't feel like a real recovery, and that's because it isn't, and I don't expect it to be for some time.
Stay alert, stay prepared. If ever there was a time for investors to stay in cash, this is it. For speculators, shorting the Treasury bond market makes the most sense.
As for the gold call, I've noticed that every time a huge number of new ETF's come out for a certain sector, it usually signals the top. I heard yesterday that the 8th, yes 8th, gold ETF just went public. Just a thought.
ReplyDeleteWenzel,
ReplyDeleteGood stuff. I am not a chart guy either. I was reading some hedge fund's published analysis of the Chinese, Japanese and US economies recently and I just skipped the ten or so charts in it. I do much better synthesizing the words into meaning in my head.
Great calls on the market. I was highly skeptical myself at the time but I am going to be more open minded about all of this going forward. I share your concern/nervousness on gold right now. Amazingly, in real terms, we're nowhere even close to the 1980's highs in any of the four major precious metals.
Robert, if monetary conditions are so tight then how come the stock market has rallied while bond yields have remained low, commodity prices have rallied an the dollar has fallen in value against other currencies?
ReplyDeleteThat's more the price trends you would expect in a loose/inflationary environment, not a tight/deflationary monetary environment.
You could be right, but you haven't explained these seemingly contradictory facts yet.
Two things. There was a huge blast of money (15% annualized) between Spt 08 and Feb 09. It takes awhile for that to work its way through the system.
ReplyDeleteSecond, we were coming off extreme panic lows, that means there was an extreme desire to hold cash, i.e. sideline money. That sideline money is being worked off now. ONce that is done, there is no backup money from the Fed.
Robert, I tried to reproduce your M2 annualized numbers in a chart (sorry, guys). So here is the annualized M2 nsa and its moving average (sorry again): http://img178.imageshack.us/img178/9229/83211653.png
ReplyDeleteCould you please comment on an apparent one-year cycle during the last 3 years? 2008 is somewhat exceptional, but the lows are like the clock...
I get the business cycle idea, but this would be the Fed-clocked business cycle generator.
Well, it is Fed generated. I don't argue with that at all.
ReplyDeletePart of it has to do with their seasonal adjustment factor. They obviously drain in July (which probably won't show up in a seasonally adjusted chart--in most years)But what I am looking at is the extremes in the swings. In both 2008 and 2009, you went from 15% annualized growth to zero or near zero--and maintained that near zero rate longer. For 2009, we still haven't seen a reversal, as of the 9-17 figures, there is still no growth.