
Stockmarket618 writes:
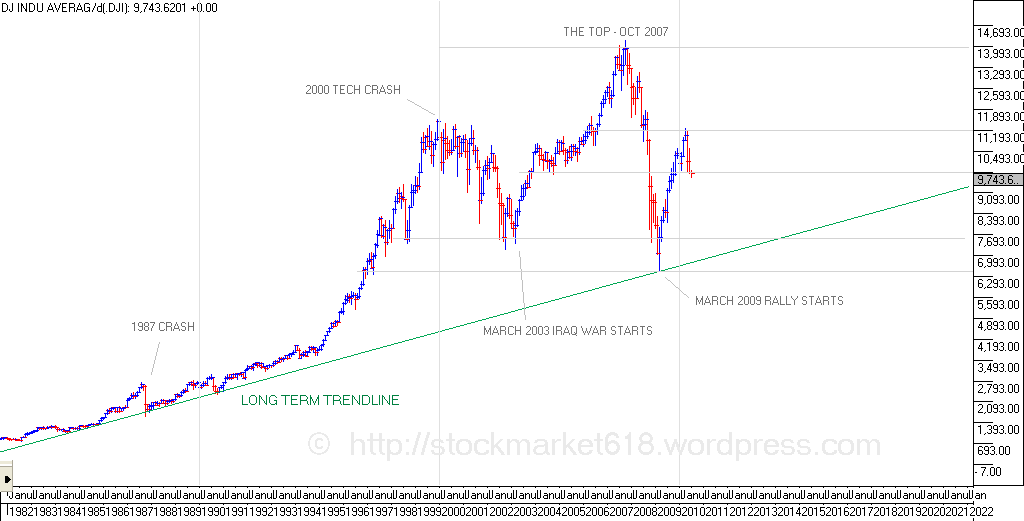
This is the scary chart I’ve been sitting on for about a year and I now reluctantly post it. It shows a potential head and shoulders pattern with a possible target of approximately 1,300For those of you skeptical of "technical analysis", I agree there is a lot of mumbo jumbo in the field. That said, old style chart reading, which Stockmarket618 appears to rely on most of the time, is based on human action.
The old style chart analyst looks for points where stock buyers and stock sellers will emerge based on the insight that many unsophisticated investors buy and sell on notions such as "I'll sell when I break even." "I bought here before and made money, so I'll do it again." etc.
The chart above is indeed scary because there is no point below Dow 6,293 where there are a lot of people who will be saying, "I bought here before and made money, so I'll do it again." (that would be indicated on a chart by a period where there is a trading range in stocks, as opposed to climbing or declining activity) After 6,293 there is no trading range where investors are going to say such until 1,300.
This doesn't mean that stocks will go that low. But, given that the Fed is not printing any money, the trend will be down. At some point, panic could takeover and really crush the market. How low will it go? Nobody knows, but there is no chartist-type support areas. Very scary.
(Note: If you want to know what a head and shoulders formation is the best reference is Technical Analysis of Stock Trends by Edwards and Magee)
...and for one of the worst efforts in technical analysis, try Intermarket Analysis by Murphy. Truly tiring stuff.
ReplyDeleteI think Karl Denninger pointed this one out a while back. I almost choked on my coffee when he proclaimed that "according to technical analysis, the target price for the SP500 would then be about 0". I don't think he pushed this prediction that hard (if I remember correctly) but there is definitely a case to be made for a horrendous decline.
ReplyDeleteThe best "bet" is by a good inverse ETF for the S+P and/or S+P
ReplyDeleteUse "real" rather than nominal data, ie non-inflation bloated numbers. Then take a reading.
ReplyDelete