
DOW/SP500 daily chart is now bearish. Weekly and monthly charts remain bearish of course. So the new downtrend first mentioned in early May this year, can now resume although chart action will remain choppy of course.
DOW weekly chart very bearish megaphone wedge continues. SP500 weekly chart very bearish megaphone wedge continues.
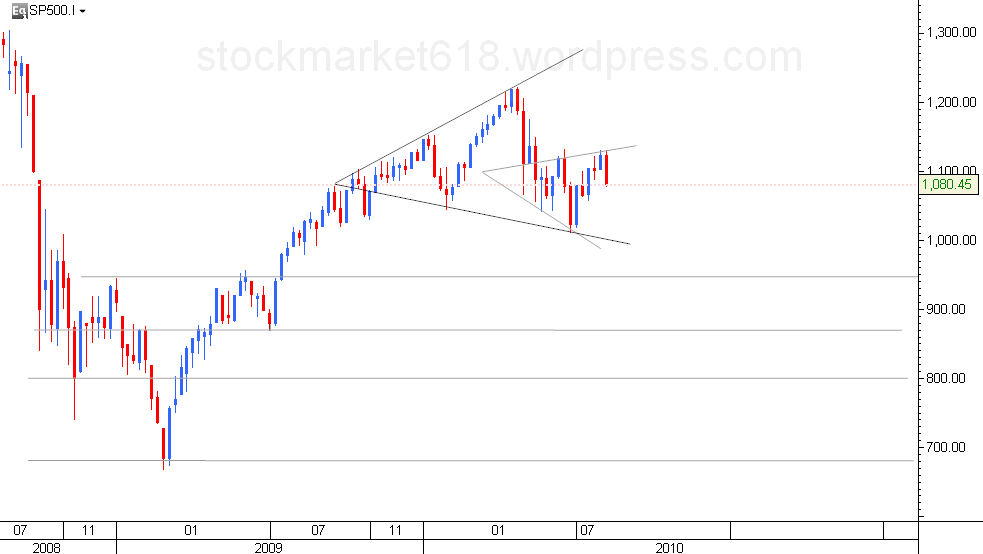
I guess it all depends on your POV. Clearly a new downtrend started on April 26 but the short-term portion of this downtrend was broken on June 10 and the intermediate portion was broken on July 22 confirming a new uptrend beginning on July 1.
ReplyDeleteIt appears the short-term portion of this new uptrend was broken on August 11 but the intermediate-term portion continues up. However, if the S&P 500 closes below 1075 that would break the intermediate-term uptrend and suggest the beginning of a new downtrend.
This is just my POV but August has been historically bullish in the second half so next week should be interesting. If the market prices move up this suggests more boring sideways movement.
On the other hand, investor sentiment and poltical trends point to a powerful rally later this year and into next if control of congress changes.
Like human behavior the possibilities are endless...